A decade ago, the phrase “data is the new oil” started popping up everywhere, and everyone was eager to hop on the big data train.
But it feels that big data hasn’t lived up to its hype. Benn Stancil even writes that big data is dying, arguing that we must ditch the “hyped promises” and build more “boring” solutions.
Boring is good. It means something simple and obvious. In web analytics, it means insights.
The struggle is real
I bet every marketer feels the pressure of being data-driven. If you’re struggling, don’t worry, you’re not alone.
According to a research by Mynewsdesk, “just one in five organizations have a consistent approach to data-driven decision-making,“ and “just one in five marketers say they’re comfortable interpreting data graphics, critiquing data presentations, and understanding when data is being used to deceive.“
Not all of us have the time or resources to become data scientists. Nor should we.
And you know what? You shouldn’t take the blame for not understanding. Instead of actionable insights, web analytics tools give you multiple views and dashboards with numbers and graphs.
1839 sessions. Time on page 33 seconds. Conversion rate 1,2%.
Nice to know, but what should I do next? A cross-channel position-based attribution model sounds dope, but does it tell me what works and doesn’t?
Instead of feeling bad about yourself, you should ask the obvious question: do I really have to browse all the data to find something meaningful?
We know marketers and website owners want insights, so why don’t we give them just that: web analytics that’s all about simple, automated insights.
How does it work? Before we dive into the solution, let’s first talk about what makes a great, actionable insight.
The anatomy of an insight
The Cambridge Dictionary defines insight as “(the ability to have) a clear, deep, and sometimes sudden understanding of a complicated problem or situation.“
Let’s go with the definition that insight is an understanding. How do we get from raw website data to understanding?
We can think of web analytics as a cake with three layers. Beginning from the bottom, we have:
- Data is the raw material for analytics. The quality of data dictates the relevancy of insights. Good quality data is accurate and relevant to your needs. The opposite of nice to know.
- Data visualization transforms the content into an easy-to-understand format. The standard UI patterns in web analytics include line graphs, pie charts, bar charts, and lists.
- Insights are the cherries on a cake, the understanding of a situation. They are meaningful moments and observations that help you understand how your marketing activities, website updates, and content pieces perform.
Let’s look at a few simple examples.
Example 1.
Not an insight: Yay, we had 8,6k visits on Thursday, 11th December!
An insight: Our product announcement on Thursday, 11th December, drove 8,6k visits from Twitter with higher engagement metrics than any other social media channel. Let’s find more ways to connect with our Twitter audience.
Example 2.
Not an insight: Nice, we had 103 conversions within the last 30 days.
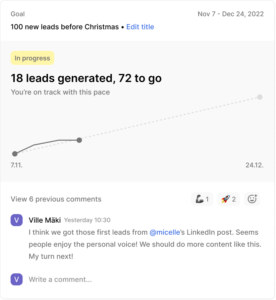
An insight: 28 leads generated, 72 to go. With this pace, we’ll hit our monthly target. Our efforts are paying, so let’s continue with the current tactics.
Example 3.
Not an insight: Boohoo, our website traffic went down 15% last month.
An insight: We updated our home page design month. There was a significant drop in engagement metrics and traffic. The new design clearly is not working as expected.
An insight contains a cause and an effect, with some added context – when and where. A good insight is valuable and helps you in decision-making. A great insight is:
- Clear and expressed in a way that makes sense to anyone. Example: You had fewer website visitors today than yesterday.
- Relevant and expresses a single thing that’s relevant to your website goals. Example: Beacon API is broken is our most engaging blog entry.
- Actionable and tells you where to focus your attention and why. Example: Fix the signup page to increase conversions.
- Statistically significant and reliable, empowering you to make confident decisions.
- Enriched with human input. Data doesn’t give you the context. Human input coupled with collected website data helps you understand more deeply why something happened.
Insight-led web analytics in practice
Volument is an insight-led web analytics tool that helps you make better decisions with simple, automated insights. You don’t have to figure out which spikes or drops are meaningful; we’ll let you know automatically.
The design problem we had was to find a perfect way to communicate the insights. The solution couldn’t be just a slicker dashboard. We had to come up with something new.
We looked for inspiration in storytelling and social media because that’s the most natural way for everyone who uses the Internet to communicate and tell stories.
When you open Volument, you see two views: Insights and Analytics. In this post, I’m going to focus on the Insights view.
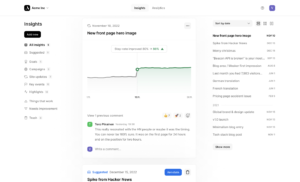
The insights view is essentially a feed of insights. You can sort your insights by type or date.
The platform automatically suggests insights when something significant – metric spikes or drops, Javascript errors – happens or our engine has made an observation based on metrics performance, either long-term or short-term.
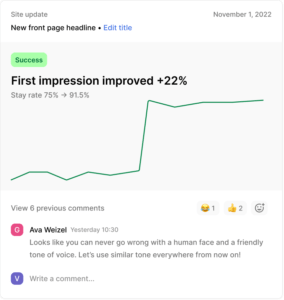
You can also add events to your timeline, and we’ll show you the impact these moments had.
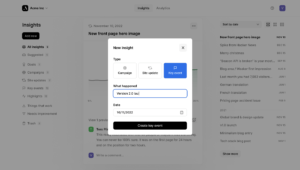
Each insight focuses on a single metric or an issue. By clicking the insight, you get more details.
There are six types of insights.
CampaignsMarketing activities with a start date and end date (optional).
Site updatesDesign or content updates on a specific page or the whole site.
Key eventsAny important event or moment that might affect your business. For example, a new competitor enters the market.
HighlightsPicks from your data: what’s happening, what works, what needs attention.
Things that workHighlights from your website: top traffic source, most engaging content piece, etc.
Needs improvementSudden metric drops or Javascript issues.
The human element
Storytelling, sharing, discussions, and reactions give more meaning to your insights.
The collaborative aspect is something that has been missing in the analytics space. But not anymore.
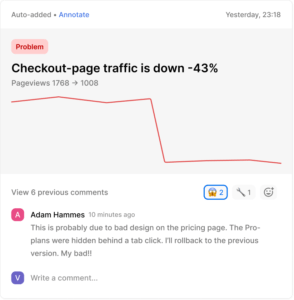
Volument is the perfect place for marketers, designers, and developers to collaborate and build better websites.
Human touch gives more context to your insights. We don’t always know the whole story when we collect data from your website. For example, if we detect a traffic spike from search engines, we can assume your SEO efforts are paying off. But if there’s a sudden spike from Hacker News, we don’t know who posted the link and why.
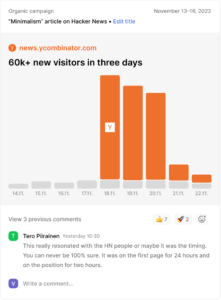
Or, say that a pandemic hits the world and your website traffic suddenly drops; the platform doesn’t know anything about a raging pandemic. You can add this as a key event, and we can show you how the pandemic affected your website traffic.
A glass onion
No matter how many layers you peel, the answer is obvious. People want insights, and this needs to be at the core of a modern web analytics experience.
The other thing that sits in plain sight is that modern web analytics should be transparent and privacy-friendly.
This is our vision of the future of web analytics: privacy-friendly and all about insights.
Leave a Reply