So what exactly is conversion optimization?
Volument is a website analytics software designed for conversion optimization — the art and science of getting more contacts, sales leads, customers, and virality. It is constant, iterative work, and Volument is the essential tool to help you along the way.
Focus on traction
Instead of measuring every little statistical detail on your website, Volument focuses on traction, and how much value you can get from a visitor. Low traction means that people leave your site quickly and never come back. High traction means that they focus on carefully your content, come back later for more, and start taking action. Here’s how it looks:
Leading indicators
Leading indicators measure what happens when the visitors enter your site for the very first time. How good is the first impression? Do they stay more than three seconds? Do they stay enough to understand the problem (~ 7s), and how the product attempts to solve the problem (~15s)? Do they continue to the next page? How much content did they consume? Did they find the product interesting (~1m engaged) and converted to “suspects”?
Leading indicators reveal how the visitors build awareness and interest on the first visit. These metrics are “actionable” because you can actually impact them. Your copywriting and design changes make a direct impact on the first impression, and whether your visitors find the content more interesting. This is why they are so critical in conversion optimization.
Lagging indicators
Lagging indicators are the key conversion events at the “bottom of the conversion funnel”. They can only happen if the visitor has passed the first two steps at the top of the funnel: they are interested in your product and have the desire to take action: join your mailing list, ask a sales question, or make a purchase.
These metrics are called “lagging” because they can happen many days after the first visit.
These metrics correlate with the leading indicators: people who leave your site quickly are less likely to buy than those, who eagerly consume your content. Those who build interest on the first visit are more likely to come back and take action.
That is: you can only increase the number of leads or sales by focusing on the leading indicators.
The real conversion funnel
Volument funnels measure the actual visitor behavior. This is different from traditional analytics, where the funnel steps are manually defined by the site owner. Volument is essentially the most popular marketing framework, AIDA (awareness, interest, desire, action), put in practice.
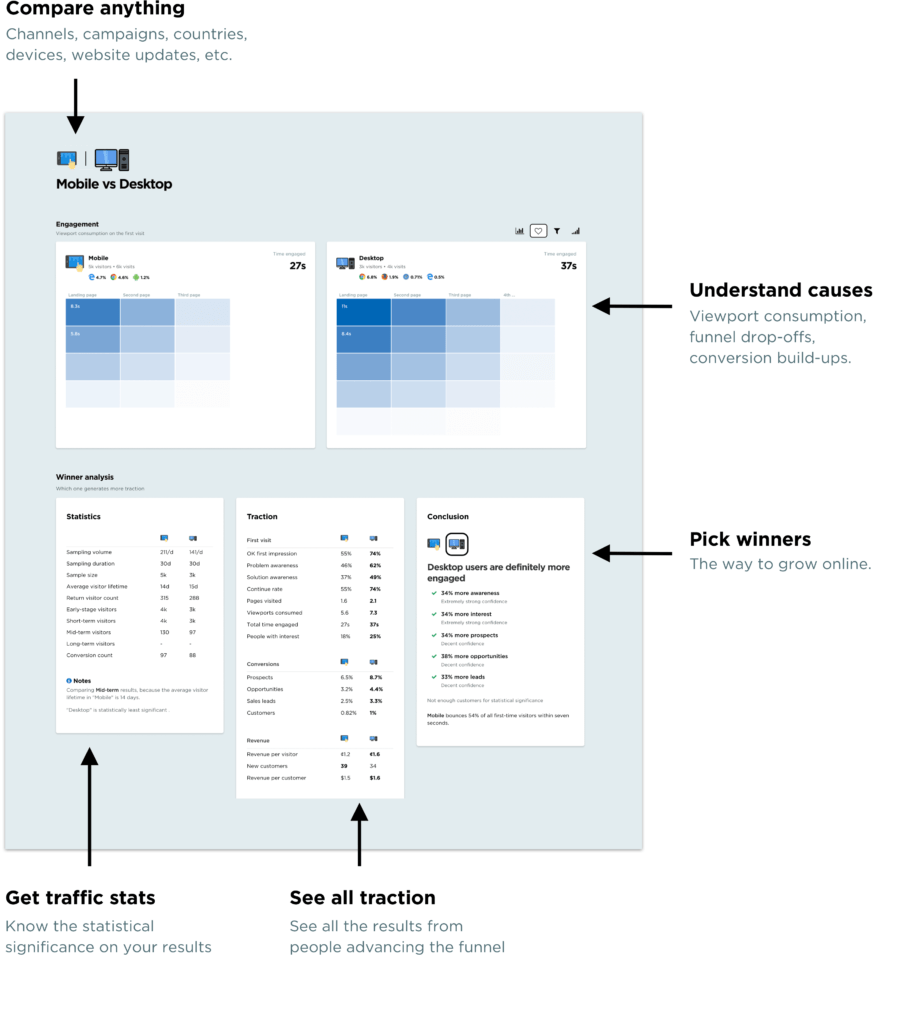
Pick winners
Ultimately, conversion optimization is about picking winners. You want better content and more engaging audiences to interact with the content. Volument makes this easy by automatically showing you the winning audiences, geographical locations, devices, and content:
Apples-to-apples
Volument uses cohort analysis to ensure that each compared item is measured equally so that the comparisons are fair. For example, a day 7 conversion rate only samples visitors with a lifetime of seven days (or more) and checks how many of them converted during that initial 7-day period. This method allows you to compare young markets, pages, and areas with the more mature ones in an apples-to-apples fashion.
Statistical significance
Volument checks whether your comparisons have enough samples for statistically significant conclusions. Each conversion rate comes with a human-friendly confidence phrase (like “decent”) so you can make confident decisions without data-science background.
Order of magnitude faster
Leading indicators have a special gem: they are fast. Really fast. For every key conversion event at the bottom of the funnel, there are thousands of leading indicators to take insights from. You’ll know whether the new version better in a matter of days — even hours on a very busy site. When you can iterate 10× faster, you can grow 10× faster, right?
Learn the causes
Volument reveals how your visitors build awareness and interest before taking action. Starting from the very first moment they enter the site, up to ninety days that follow.
By seeing your content and audiences this way, side-by-side, you begin to understand your strong areas and weaknesses — where people lose their interest. These bottlenecks are your low-hanging fruits with the largest potential for growth.
Contrast this to traditional analytics and A/B testing where you must guess or “hypothesize” your next move.
Start growing
Volument is designed to help different team members to contribute to the success of their website.
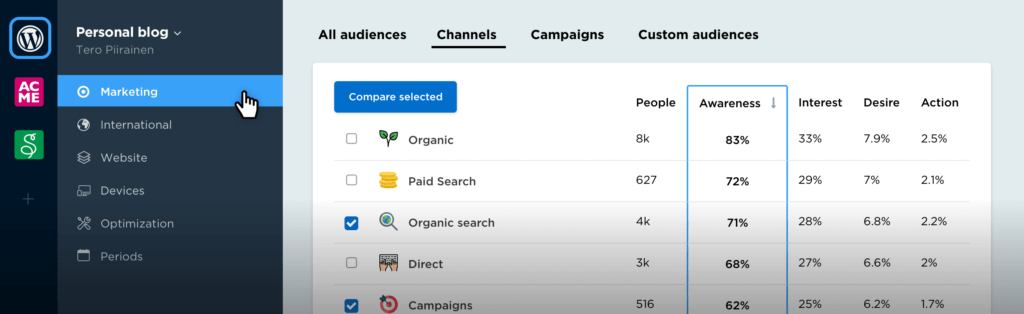
Marketers can discover new channels, audiences, and geographical locations and target the best ones.
Designers can look for engagement bottlenecks and attempt to fix them. The leading indicators are tightly coupled to user experience, so they will go up with great design choices and down with the bad ones (like fullscreen sales/consent dialogs). Eventually turning your website into something people enjoy using.
Developers can discover broken devices and screen resolutions and fix them. This causes more people to stay on the website, for longer times, and they consume more content.
Writers can see what content works and what turns people away, and use this skill in their next article.
Think of all the best websites in the world and compare them to the ones that struggle to be one, what’s the difference? The desperate ones shoot you with large pop-ups, banners, and call-to-action buttons. They start selling as soon as the page is loaded. They attempt to impact the lagging indicators directly. Their funnel strategy is bottom-up.
Conversely, the best sites like Apple, Stripe, and AirBnB are beautifully designed and treat you like a person. They strive for a remarkable first impression and user experience.
Summing up
Let’s sum up how Volument works: