Analytics the way it should be
Like all analytics services, Volument implements a data pipeline to collect, store, and present the data to users. Our pipeline just happens to be very different from how other analytics products are implemented. We think this is how all modern pipelines should work.
Data collection
How Volument captures data from the visitor device
Focus on engagement
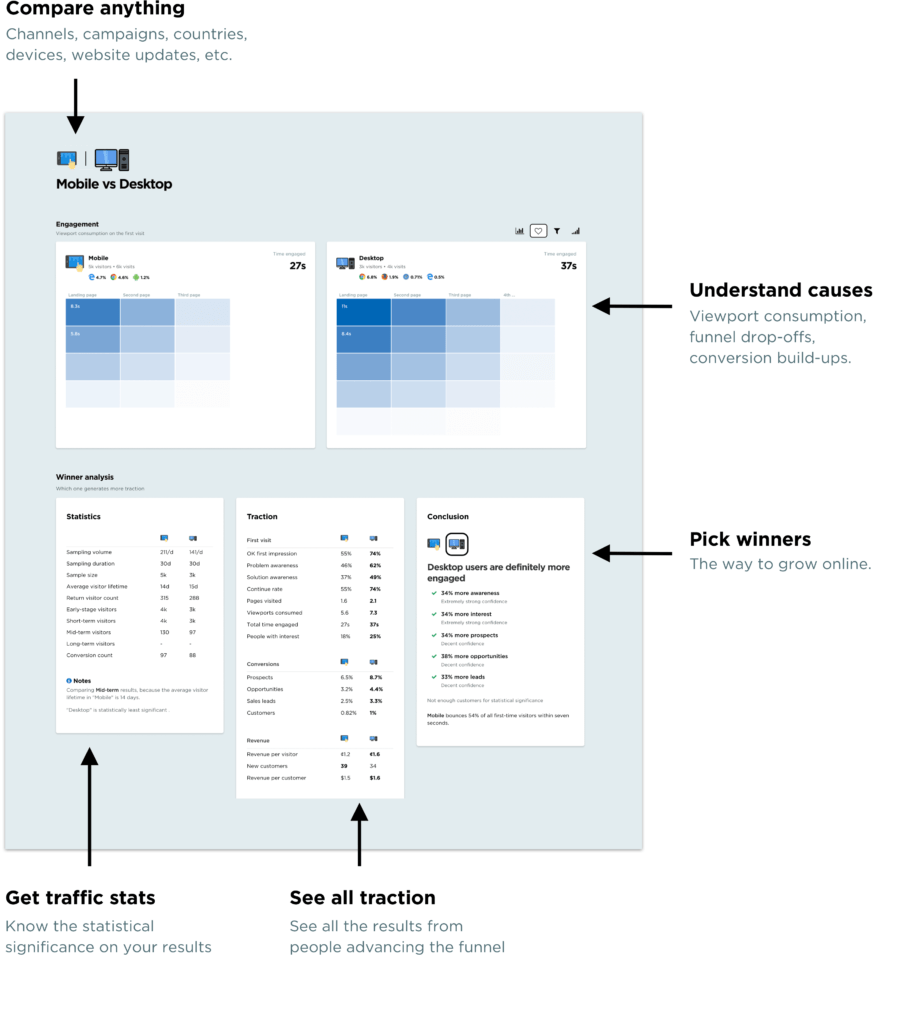
The first big difference between Volument and other analytics tools is that Volument focuses on content engagement: how people interact with your site before taking action. You can, for example, see whether your issue is on the first impression, badly written content, performance, or having too many errors on page load. These “leading indicators” at the top of the conversion funnel are critical because they help you understand the causes: not just what happened, but why it happened.
Volument measures engagement on the client by monitoring user activity. This is the only way to do it: you cannot measure engagement on the server side as Google Analytics does.
Privacy- friendly
Volument is privacy-friendly analytics. All measurement is done anonymously and no personal data is collected. There are no persistent user identifiers, no cross-site tracking, and your data is not used for any different purpose. All data is exclusively processed with servers owned and operated by European companies and the data never leaves the EU.
Legally safe
Volument is the only web analytics that supports full compliance with all privacy regulations out there. This includes GDPR, CCPA and PECR, and ePrivacy. Currently, nobody respects ePrivacy, except Volument. Not even the other privacy-friendly options like Plausible, Fathom, and Simple Analytics. We play the long-term game: Volumentis 100% legally safe. It’s the right thing to do.
Data storage and transformation
How we take in data and hand it for the presentation layer
Dummy and cheap
One of the early goals of Volument was to offer a free tier for all small- and medium-traffic websites. For that, we needed to design our backend from the ground up to handle the “infinite” scale at very low costs. We did this by keeping our backend as dummy as possible and pushing all the complexities to both ends of the pipeline. For example, we don’t use a database; we store our data in immutable JSON files instead. With less moving parts means we have fewer things to worry. The system is more scalable and reliable.
Insight- friendly
Volument is insight-led analytics. This puts some extra pressure on the backend: we must provide the data for the frontend in a format that is good for delivering insights. The traditional SQL-based model does not work because the queries are always tied to a specific time range. Insights are different: they can reside anywhere on the timeline and they can be short-term or long-term.
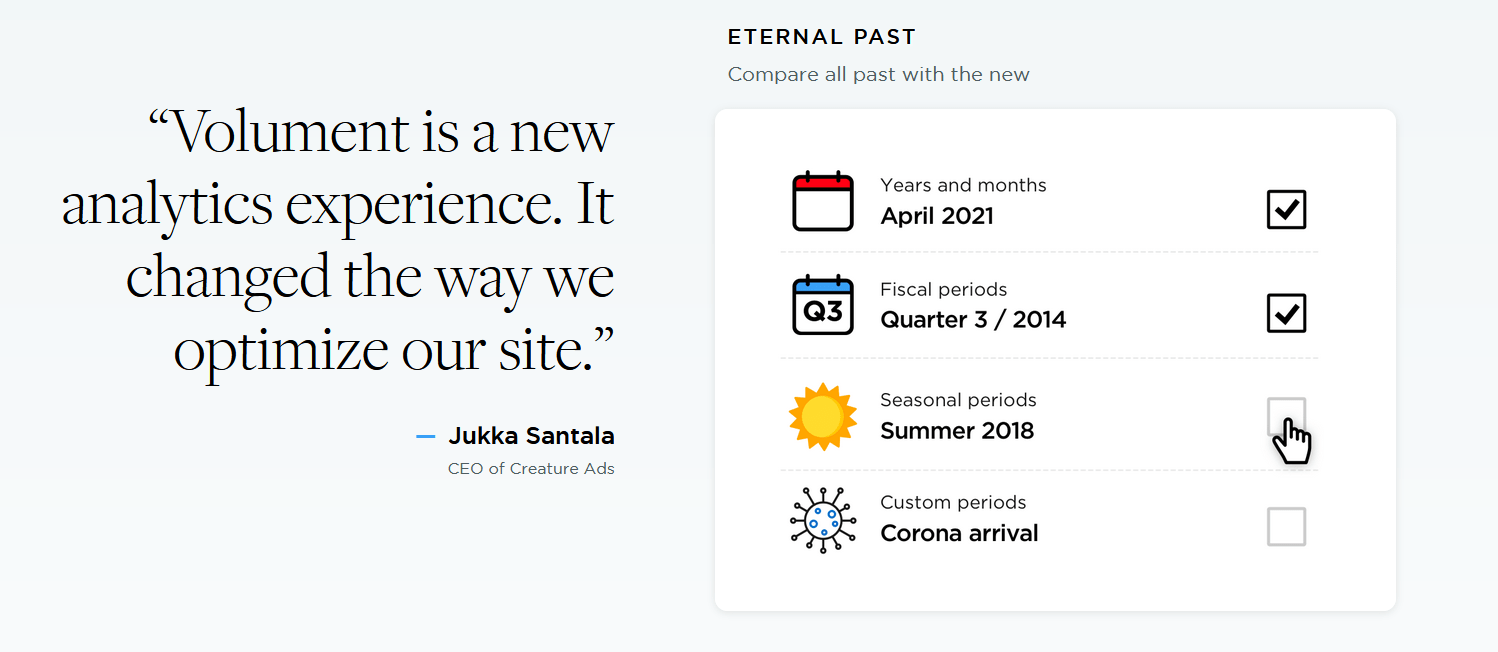
We solved this by grouping data into monthly chunks that are cached forever on the browser. Two big wins here: the UI loads quickly and the frontend has near-instant access to complete data history. This is ideal for an insight-led analytics tool. No matter how much data you have: one year, ten years, or hundred years — we read it all in memory and spit out vital and never-seen-before insights.

Data visualization
How we present data for the users
Insights view
The whole purpose of analytics is to help us see meaningful insights that we might not otherwise detect. It’s surprising to see how all the major analytics tools on the market are stuck on the idea of building an improved analytics experience, but not paying much attention to insights. We do the opposite: we put insights into the forefront of analytics.
Analytics view
Being insight-led means that the primary view is insights and analytics is there for viewing the details of the insights. Analytics offers transparency. For each insight, you get to browse everything that happened on the Insight-specific time range. Compared to Google, Volument is easy to understand and you get all the essentials on one page without diving into a multi-layer menu hierarchy.
Collaboration features
Machine-generated insights are significantly more valuable when they are coupled with human wisdom. Humans know what happened in real life. Things that machines cannot see. All team members can comment and react, and make the insight mean a lot more. Commenting and sharing is a natural fit for data-driven storytelling. It makes analytics more powerful, sometimes even fun. Collaborative analytics is a whole new experience.
